摘要
- 基于网络爬虫的可视化图表:golang,goquery
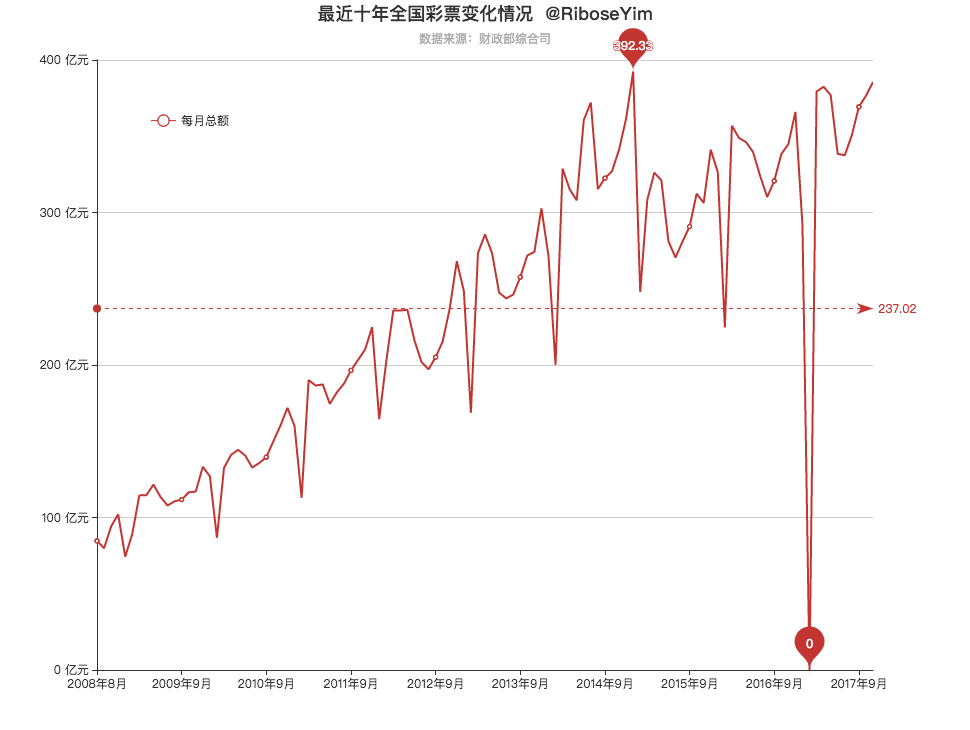
- 案例:最近十年全国彩票销售变化情况
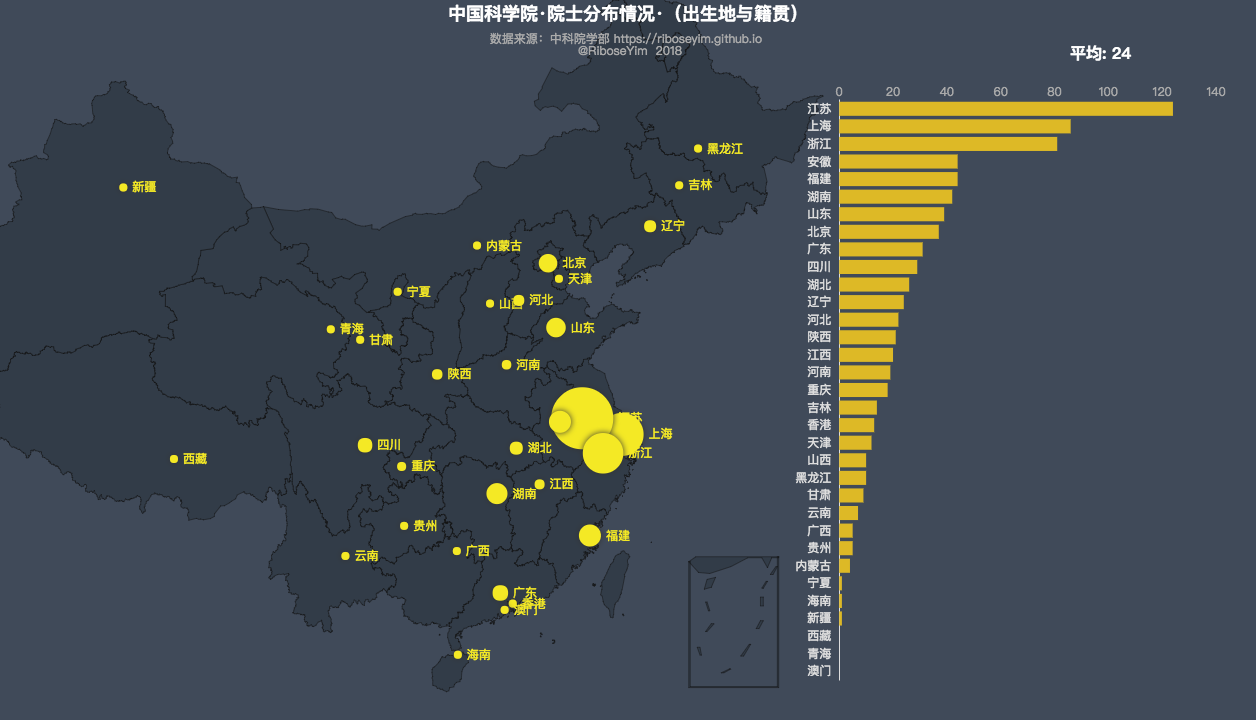
- 案例:中国科学院院士分布
- 数据可视化技术方案:基于 SVG (D3、Raphael)、基于 Canvas(Echarts)
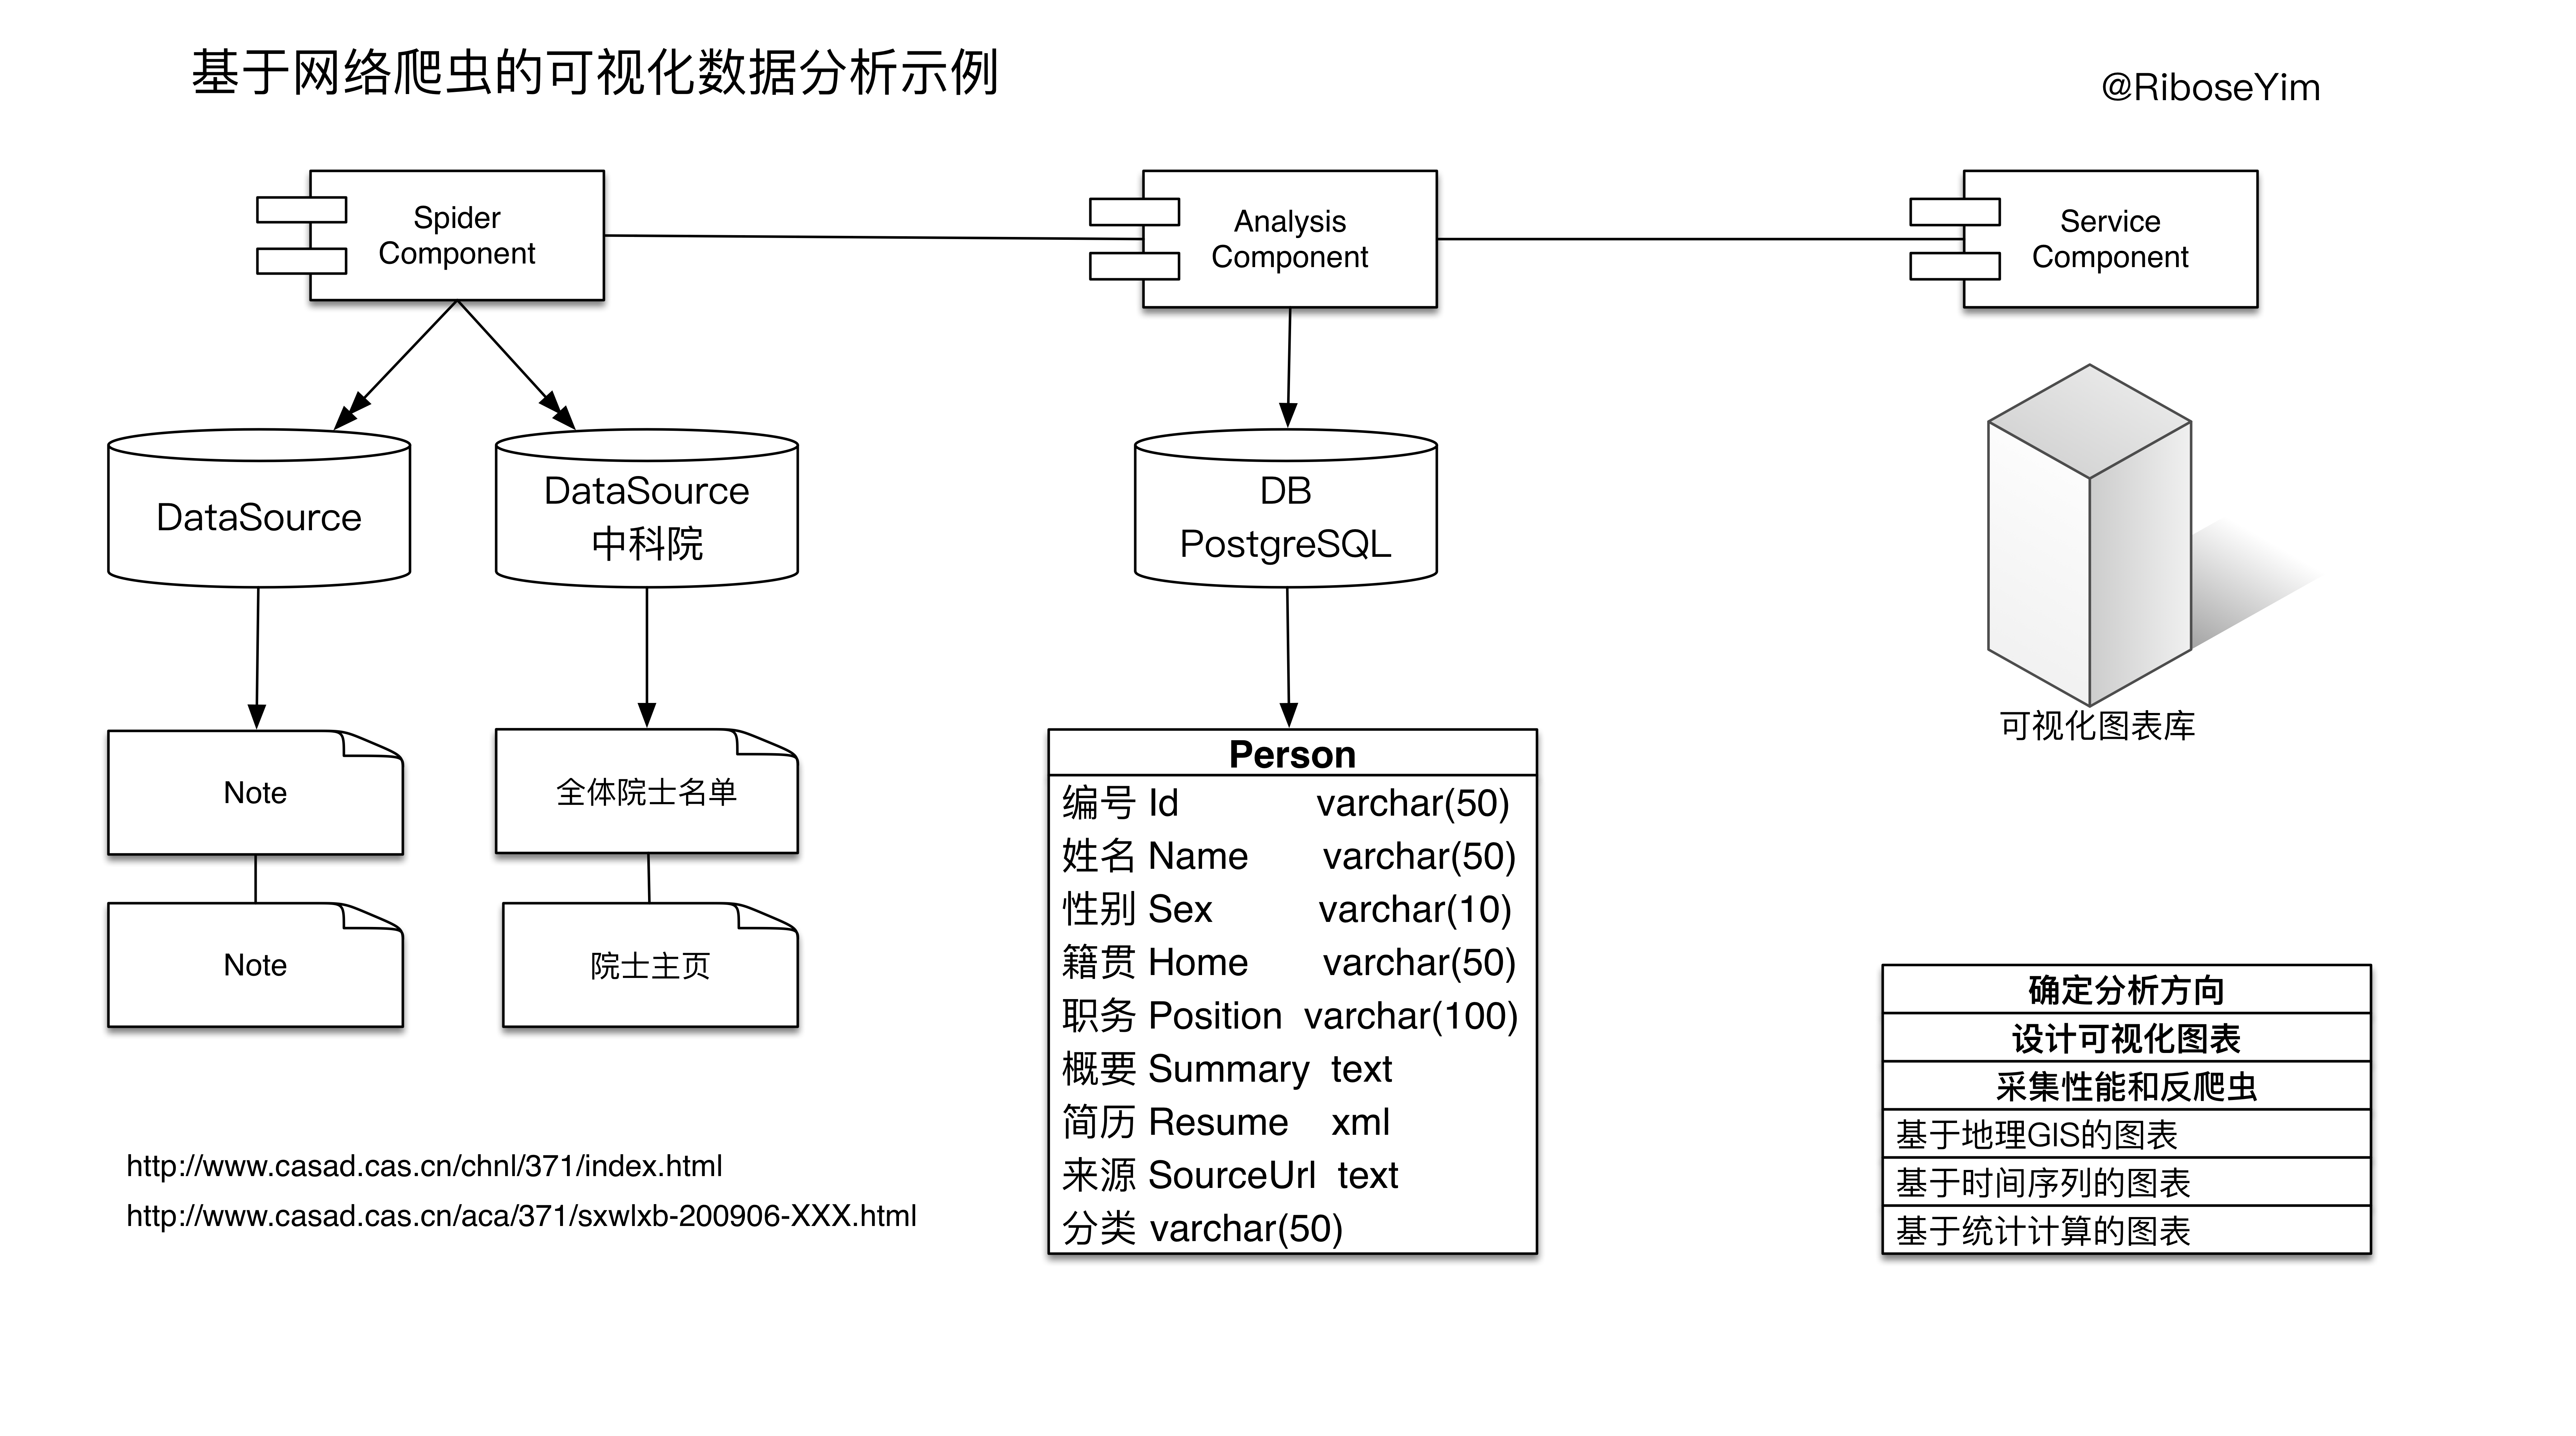
基于网络爬虫的可视化图表
我们身处大数据时代,几乎在所有工作例如商业技术、金融、科研教育等行业,以及日常生活中都可能需要涉及数据分析活动。横向来看数据分析的知识体系贯穿数据获取、数据存储、数据分析、数据挖掘、数据可视化等各大部分;按数据来源分,即可以是自己收集的数据,也可以采购数据或者基于公开数据集。
基于公开数据进行分析的话,必须提到的就是网络爬虫(web crawler),也被称作网络蜘蛛(spider)、自动索引程序(automatic indexer),搜索引擎(Google,百度等)就是大众日常生活中接触到的最典型、最强大的爬虫。
公开数据包括政府(统计局、央行、银监会、证监会等)、企业、社会组织和互联网上的个人发布信息等。在浩如烟海的互联网内容中,有价值信息犹如‘待字闺中’深藏的美女,等待有心人去挖掘。例如:
为了实现上述图表,相关技术方案的要点如下:
- 开发语言:
基于 Golang 实现爬虫基本功能,主要考虑 Go 语言 自身对于网络方面的强大支持,语言级 Goroutines 提供并发高性能支持。 - HTML选择器: goquery jQuery-style HTML manipulation in Go
- 数据存储: csv,PostgreSQL 等
- 数据可视化:ECharts
案例
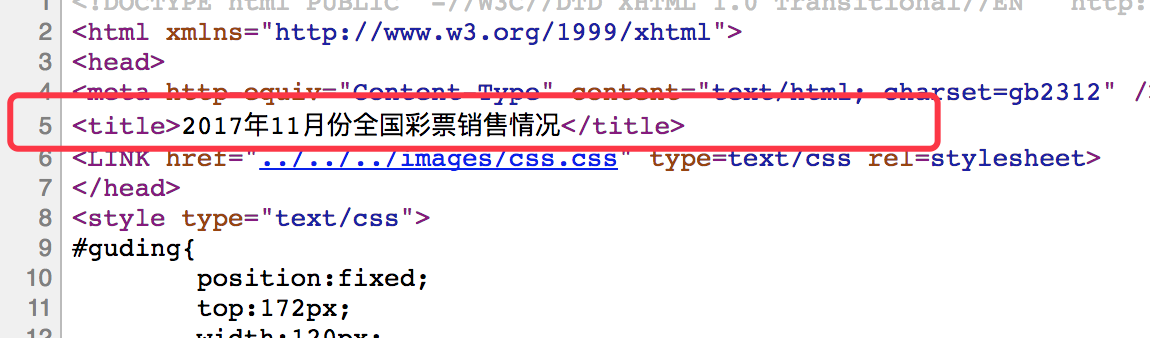
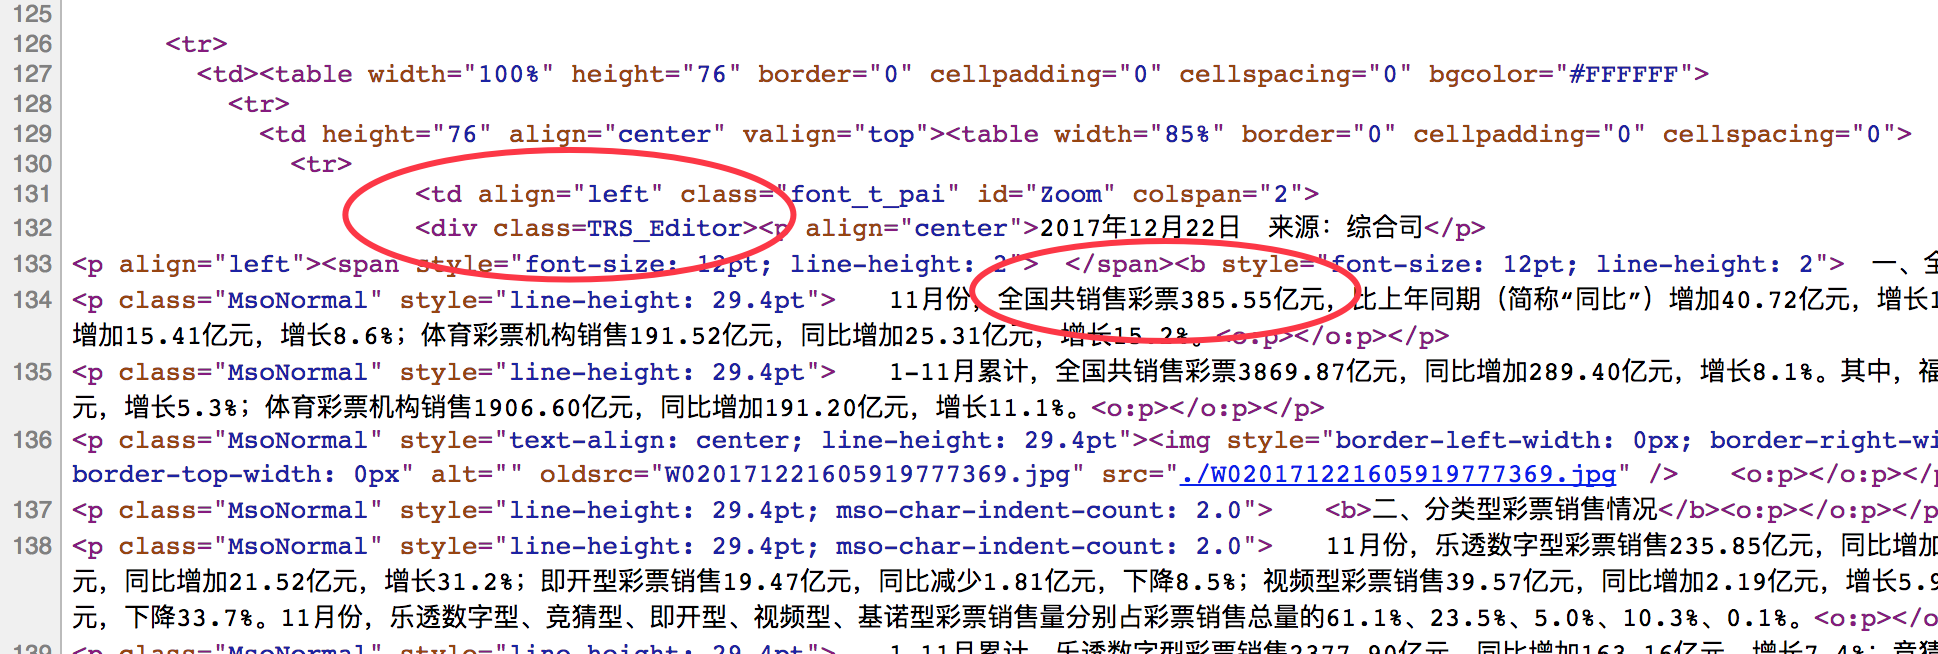
数据来源页面:


1 | //caipiao_task.go |
1 | //caipiao_spider.go |
2017年11月份全国彩票销售情况,385.55
2017年10月份全国彩票销售情况,376.53
2017年9月份全国彩票销售情况,369.28
2017年8月份全国彩票销售情况,350.67
2017年7月份全国彩票销售情况,337.55
2017年6月份全国彩票销售情况,338.42
可视化图表:以 ECharts 为例
常见的图表库,本文案例使用 ECharts 作为图表组件
- HighCharts:JavaScript 编写,开源许可证允许个人用户和非商业用途。
- Baidu ECharts:底层画图基于 Canvas, BSD 许可证协议。
- Kartograph:构建交互式地图轻量级类库。
1 | //http://echarts.baidu.com/demo.html#line-gradient |
最佳实践
- 默认调色板(palette)
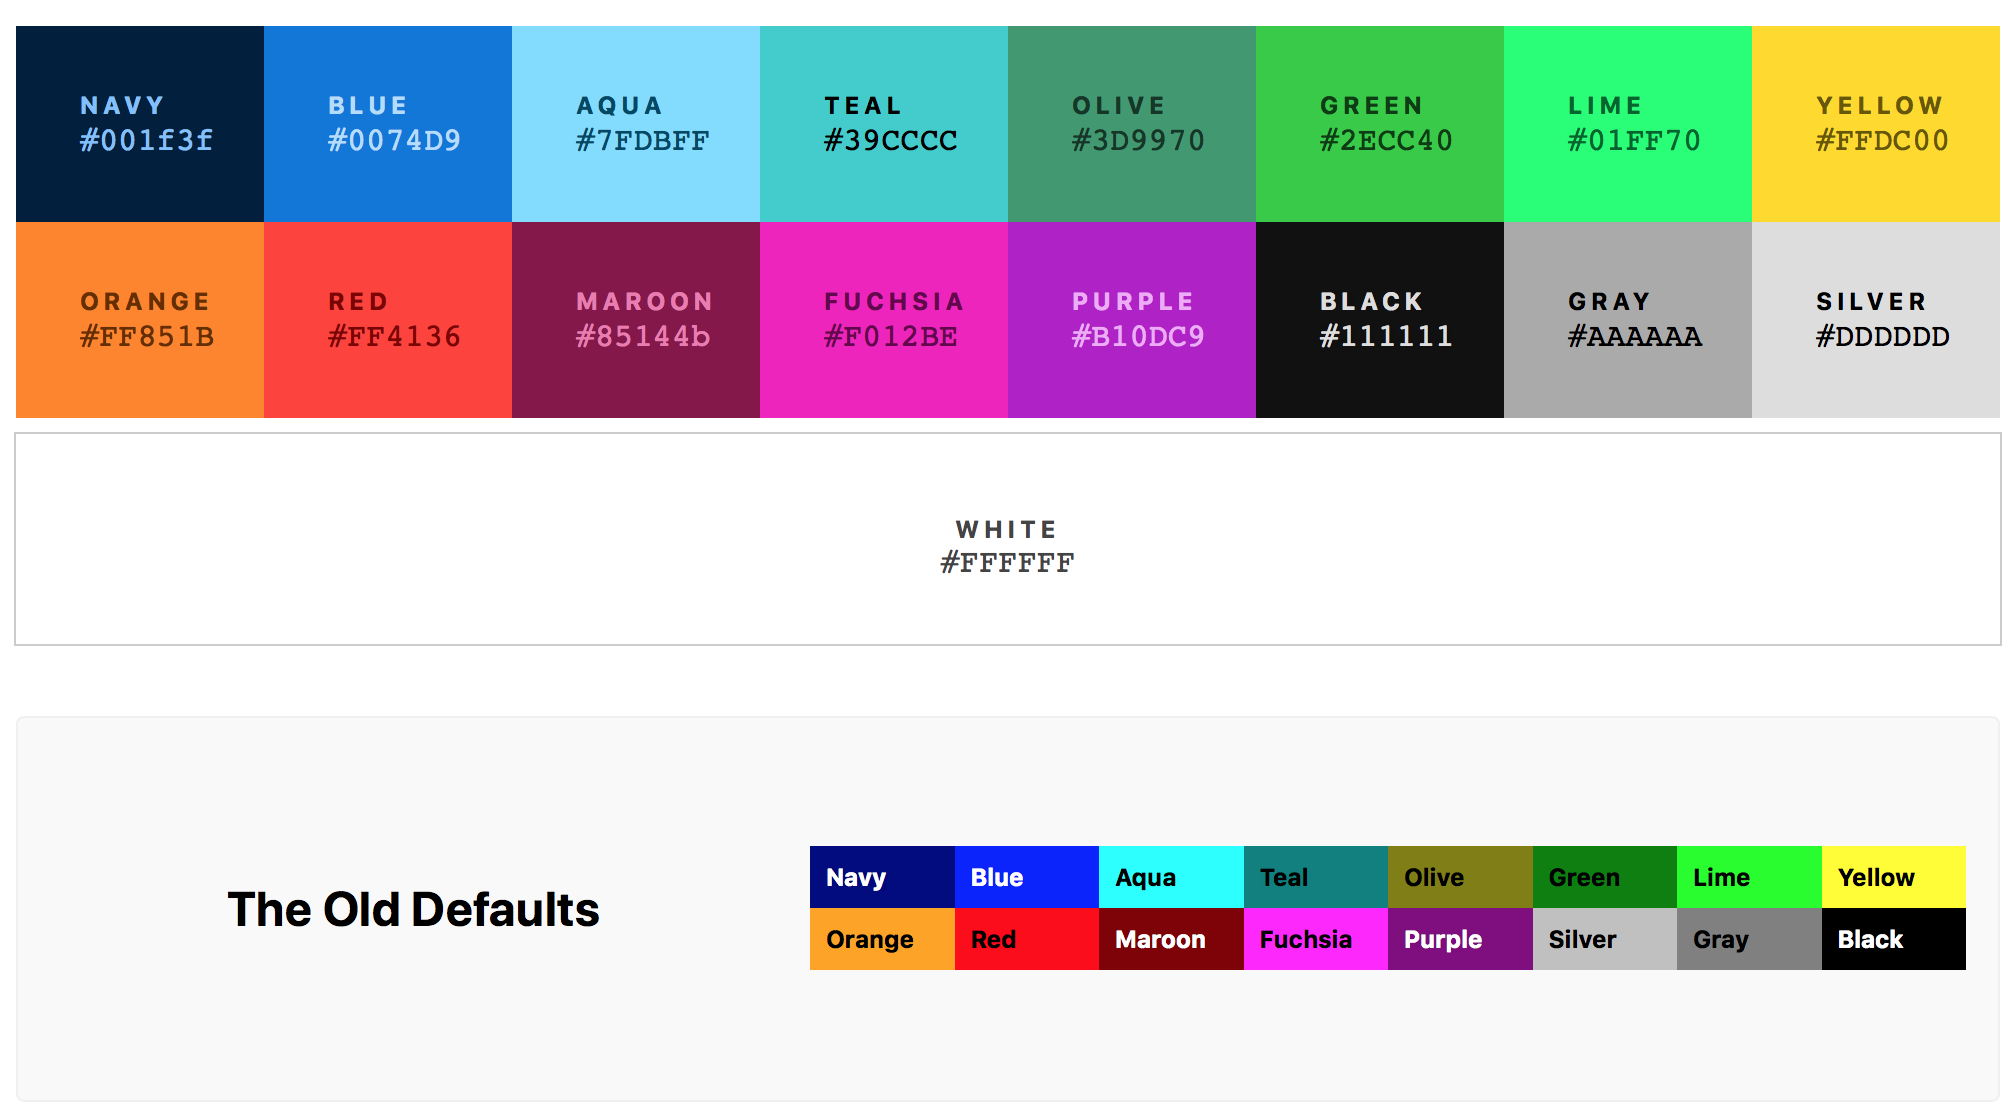
1 | Navy — #001f3f |
优化图表JS生成模板
图表定型之后,可以通过模板固化配置,根据需要动态生成目标文件(html,js,svg等等),详见基于 Markdown 的 HTML 网页模板。优化采集器 Goroutines “线程池”
例如:PostgreSQL Exception: Open too many files优化数据存储
例如:常用的 GIS 坐标库
扩展阅读:开源工具与案例
在线词云
- WordArt.com:仅支持英文,精美,首选
- Tagxedo:支持中、英文(中文分词效果一般),需要安装插件Silverlight
- Tag Crowd & Google Adwords
golang-based library
- golang.org/net/http
- github.com/celrenheit/spider
- goquery: jQuery-style HTML manipulation in Go
- github.com/henrylee2cn/pholcus_lib
- Pholcus is a distributed, high concurrency and powerful web crawler software
可视化图表案例
可视化图表技术方案
基于 SVG : D3、Raphael
基于 Canvas : Echarts
HighCharts
国外开源产品,JavaScript 编写,自带主题、动态交互方便,目前公司新版业务视图、地图应用、交互式流量图等是基于这个库实现。
不足:缺少中文文档,开源许可证只允许个人用户和非商业用途,规模应用存在法律风险。Baidu ECharts
最早源于百度各种业务系统报表需求,底层画图基于 Canvas 。2013年开源,完全免费的BSD协议。
特点:拖拽重计算,第三方标准格式支持,中文社区支持
实例:http://echarts.baidu.com/doc/example.html
Github: https://github.com/ecomfe/echarts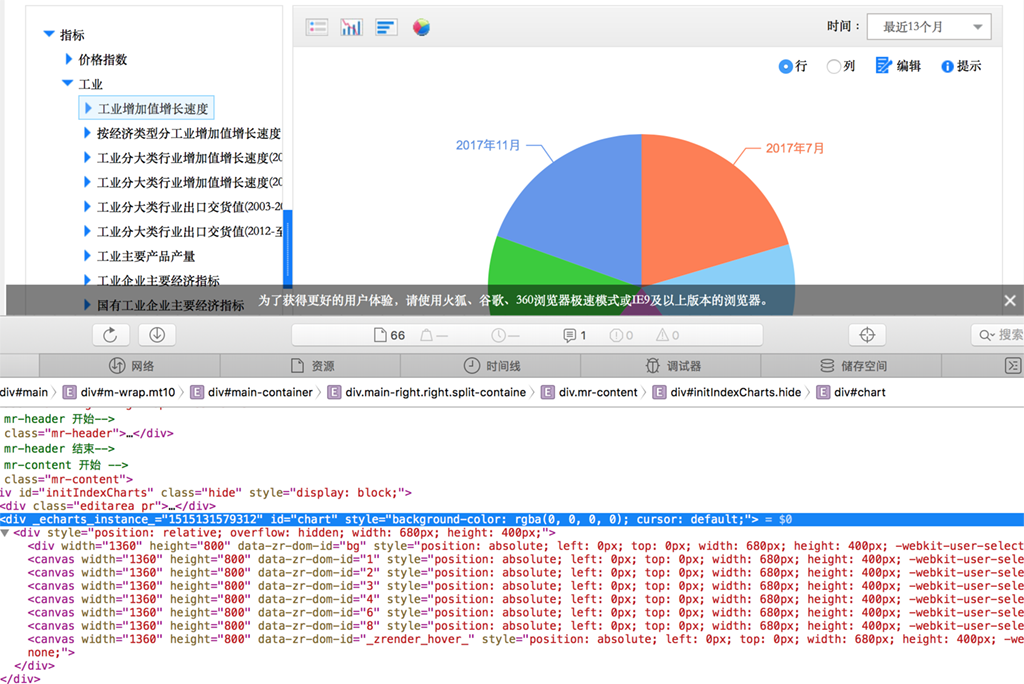
Kartograph
Kartograph 是个构建交互式地图的简单、轻量级类库。它包含两个库,一个用Python写的,用于产生漂亮和压缩的SVG地图,另一个是js类库用于前端展示地图用。
扩展阅读:数据可视化
- 数据可视化(一)思维利器 OmniGraffle 绘图指南
- 数据可视化(二)跑步应用Nike+ Running 和 Garmin Mobile 评测
- 数据可视化(三)基于 Graphviz 实现程序化绘图
- 数据可视化(四)开源地理信息技术简史(Geographic Information System
- 数据可视化(五)基于网络爬虫制作可视化图表
- 数据可视化(六)常见的数据可视化仪表盘(DashBoard)
- 数据可视化(七)Graphite 体系结构详解
- 数据可视化(八)Program,Data and Classical Music
- 数据可视化(十)公共数据源列表