摘要
- Distributed Tracing and Monitoring System
- OpenCensus: A framework for distributed tracing
- OpenCensus Principle: data structure 、Context

This article is part of an Distributed Tracing and Monitoring System tutorial series. Make sure to check out my other articles as well:
绪论
随着互联网技术的高速发展,以往单应用的服务架构已经很难处理如山洪般增长的信息数据,随着云计算技术的大规模应用,以微服务、RESTful 为代表的各种软件架构广泛应用,跨团队、跨编程语言的大规模分布式系统也越来越多。相对而言,现在要理解系统行为,追踪诊断性能问题会复杂得多。
在单应用环境下,业务都在同一个服务器上,如果出现错误和异常只需要盯住一个点,就可以快速定位和处理问题;但是在微服务的架构下,功能模块天然是分布式部署运行的,前后台的业务流会经过很多个微服务的处理和传递,就连日志监控都会成为一个大问题(日志分散在多个服务器、无状态服务下如何查看业务流的处理顺序等),更不要说服务之间还有复杂的交互关系。
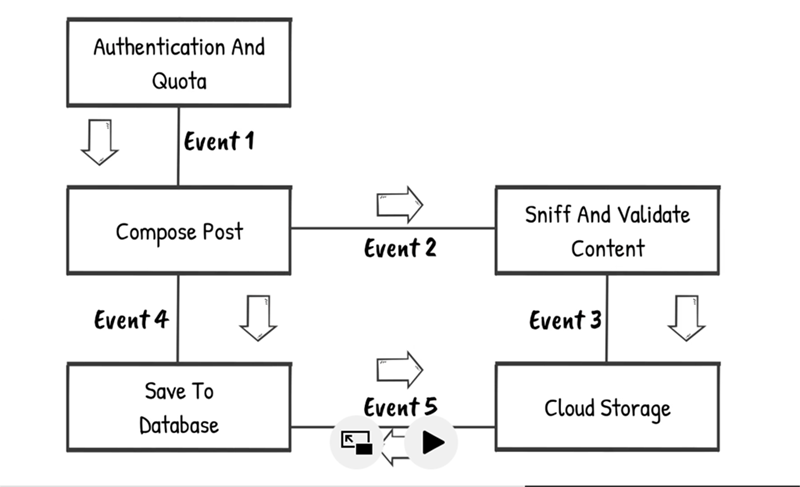
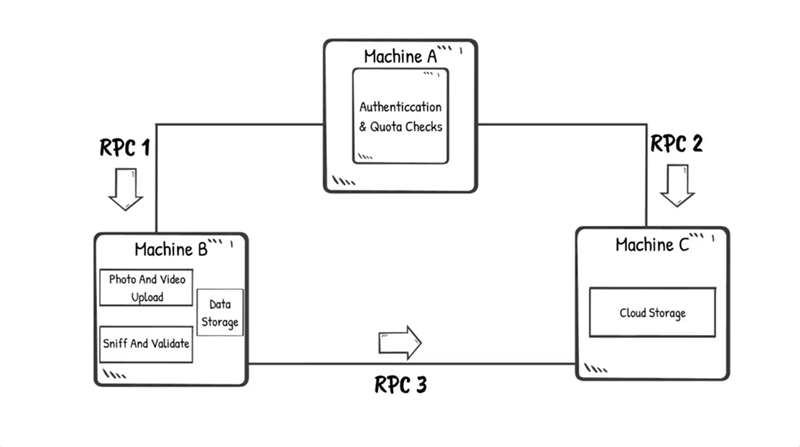
用户的一个请求在系统中会经过多个子系统(或者多个微服务)的处理,而且是发生在不同机器甚至是不同集群,当发生异常时需要快速发现问题,并准确定位到是哪个环节出了问题。对系统行为进行跟踪必须持续进行,因为异常的发生是无法预料的,有些甚至难以重现。跟踪需要无所不在,否则可能会遗漏某些重要的故障点。
为了解决上述问题,分布式跟踪系统 —— 一种帮助理解分布式系统行为、帮助分析性能问题的工具应运而生。
第一部分 Google Dapper : Distributed Tracing and Monitoring System
Modern Internet services are often implemented as complex, large-scale distributed systems.These applications are constructed from collections of software modules that may be developed by different teams, perhaps in different programming languages, and could span many thousands of machines across multiple physical facilities. Tools that aid in understanding system behavior and reasoning about performance issues are invaluable in such an environment.
在分布式追踪领域著名的论文《Dapper, a Large-Scale Distributed Systems Tracing Infrastructure|Google Technical Report dapper-2010-1, April 2010》 Google 工程师提出了关于分布式跟踪系统的一些重要概念:
Annotation-based,基于标注或植入点(埋点)
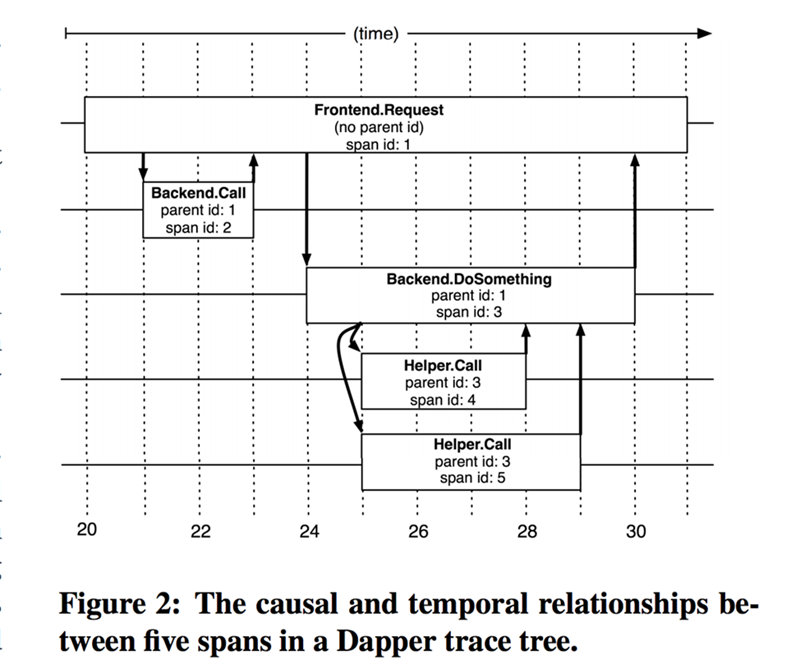
在应用程序或中间件中明确定义全局标注(Annotation),一个特殊的ID,通过这个 ID 连接每一条请求记录。当然,这需要代码植入,在生产环境中可以通过一个通用组件开放给开发人员。跟踪树(trace tree)和 span
在 Dapper 跟踪树中,基本单元是树节点(分配 spanid)。节点之间通过连线表示父子关系,通过 parentId 和 spanId 把所有的关系串联起来,实现记录业务流的作用。
第二部分 OpenCensus: A framework for distributed tracing
OpenCensus is a framework for stats collection and distributed tracing.
Google Dapper 的定位更准确的说是分析系统,并不能解决从生产服务中提取数据的难题,OpenCensus 项目为此提供了解决方案。
![]()
OpenCensus 项目是 Google 开源的一个用来收集和追踪应用指标的第三方库。OpenCensus 能够提供了一套统一的测量工具:跨服务捕获跟踪跨度(span)、应用级别指标以及来自其他应用的元数据(例如日志)。OpenCensus 有如下一些主要特点:
- 标准通信协议和一致的 API :用于处理 metric 和 trace
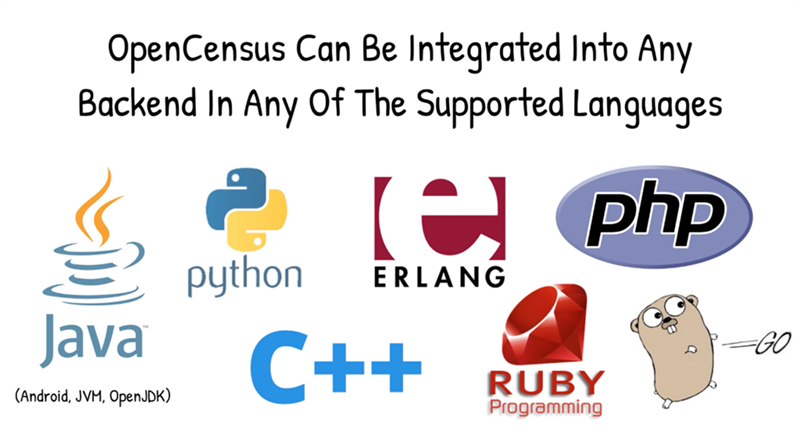
- 多语言库,包括Java,C++,Go,.Net,Python,PHP,Node.js,Erlang 和 Ruby
- 与 RPC 框架的集成,可以提供开箱即用的追踪和指标。
- 集成的存储和分析工具
- 完全开源,支持第三方集成和输出的插件化
- 不需要额外的服务器或守护进程来支持 OpenCensus
- In process debugging:一个可选的代理程序,用于在目标主机上显示请求和指标数据
OpenCensus Concepts
Tags | 标签
OpenCensus 允许系统在记录时将度量与维度相关联。记录的数据使我们能够从各种不同的角度分析测量结果,即使在高度互连和复杂的系统中也能够应付。
标签以键值对的形式在上下文中传递,并且允许在当前上下文中添加或修改。
1 | ctx, err = tag.New(ctx, |
Stats | 统计
Stats 收集库和应用程序记录的测量结果,汇总、导出统计数据。为了实现低开销( a low-overhead framework even if instrumentation is always enabled ),数据点记录和数据聚合是分离的,OpenCensus 统计收集分两个阶段进行:
- 测量的定义和数据点的记录 | Definition of measures and recording of data points
- 视图的定义和记录数据的聚合 | Definition of views and aggregation of the recorded data
Recording | 记录
量度 (Measurements) 是与测量相关联的数据点。(Measurements are data points associated with a measure.)
记录 (Recording) 利用上下文中所提供的标签隐式地标记量度集合。(Recording implicitly tags the set of Measurements with the tags from the provided context.)
1 | stats.Record(ctx, videoSize.M(102478)) |
Trace | 跟踪
Trace 是嵌套 Span (跨度)的集合。Trace 包括单个用户请求的处理进度,直到用户请求得到响应。Trace 通常跨越分布式系统中的多个节点。跟踪由 TraceId 唯一标识, Trace 中的所有 Span 都具有相同的 TraceId 。
一个 Span 代表一个操作或一个工作单位。多个 Span 可以是“Trace”的一部分,它代表跨多个进程/节点的执行路径(通常是分布式的)。同一轨迹内的 Span 具有相同的 TraceId。
1 | ctx, span := trace.StartSpan(ctx, "your function name") |
视图 | Views
视图用于聚合测量结果。你可以把它们看作是对记录数据点(量度)集合的查询。
视图包括两个部分:分组标签(group by)和聚合类型(aggregation type)。
目前 OpenCensus ( Golang API ) 支持三种类型的聚合:
- CountAggregation 用于记录被抽样的次数;
- DistributionAggregation 用于提供包含一系列样本值的直方图;
- SumAggregation 用于汇总所有样本值。
1 | distAgg := view.Distribution(0, 1<<32, 2<<32, 3<<32) |
示例:创建一个视图( DistributionAggregation,指标 “videoSize” )
1 | if err := view.Register(&view.View{ |
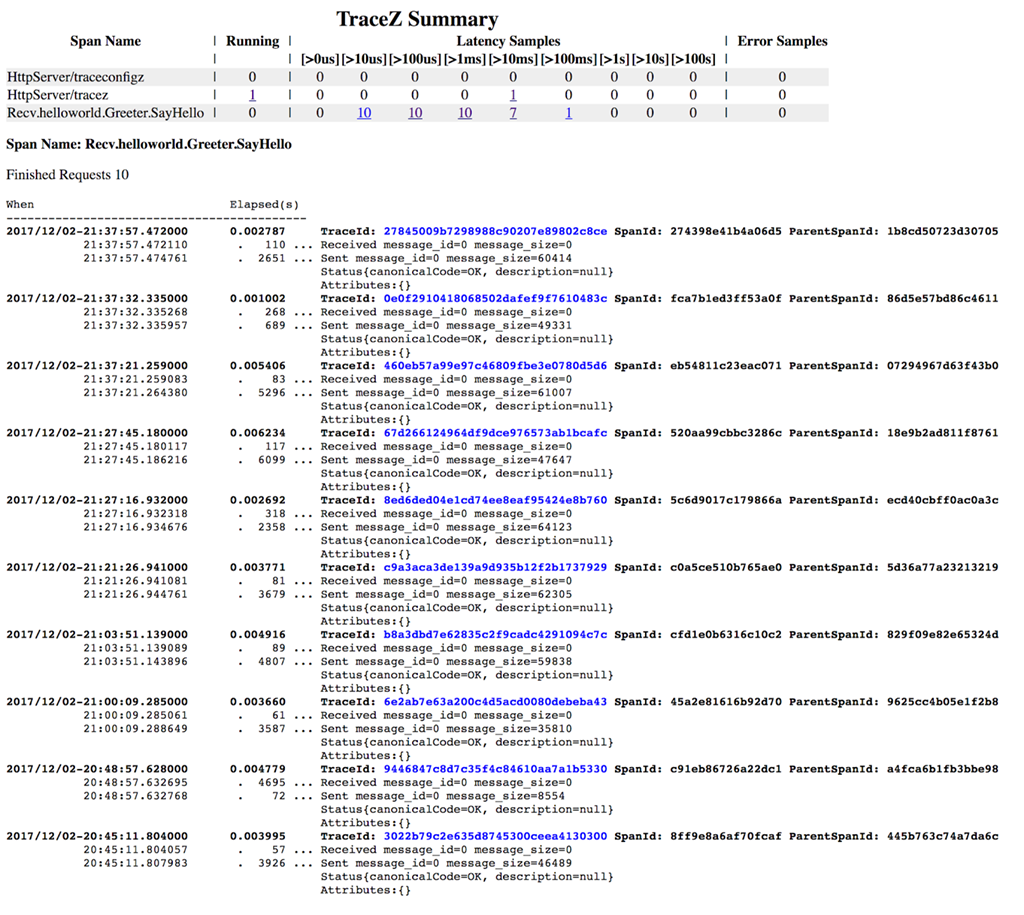
Introspection | 内省
OpenCensus 提供在线仪表板,显示进程中的诊断数据。这些页面被称为 z-pages ,它们有助于了解如何查看来自特定进程的数据,而不必依赖任何度量收集器或分布式跟踪后端。
OpenCensus Examples
创建指标
- 定义指标类型
- 定义显示方式
Track Metrics 一般需要考虑服务负载(Server Load)、响应时间(Response Time)、误码率(Error Rates)等。
实例:
- opencensus-go-examples-helloworld
- opencensus-java-examples
- “Hello, world!” for web servers in Go with OpenCensus
1 | import ( |
收集指标数据
- Call the Record method
1 | // Go Code Example |
第三方数据接口 | Exporter
OpenCensus 是独立于供应商的。OpenCensus 收集和跟踪的应用指标可以在本地显示,也可将其发送到第三方分析工具或监控系统实现可视化,例如:
- Prometheus|普罗米修斯
- Stackdriver|适用于 Google Cloud Platform 与 AWS 应用的监控、日志记录和诊断工具 | 示例
- Zipkin
- OpenCensus Tracing with Uber’s Jaeger project
1 | import ( |
数据可视化
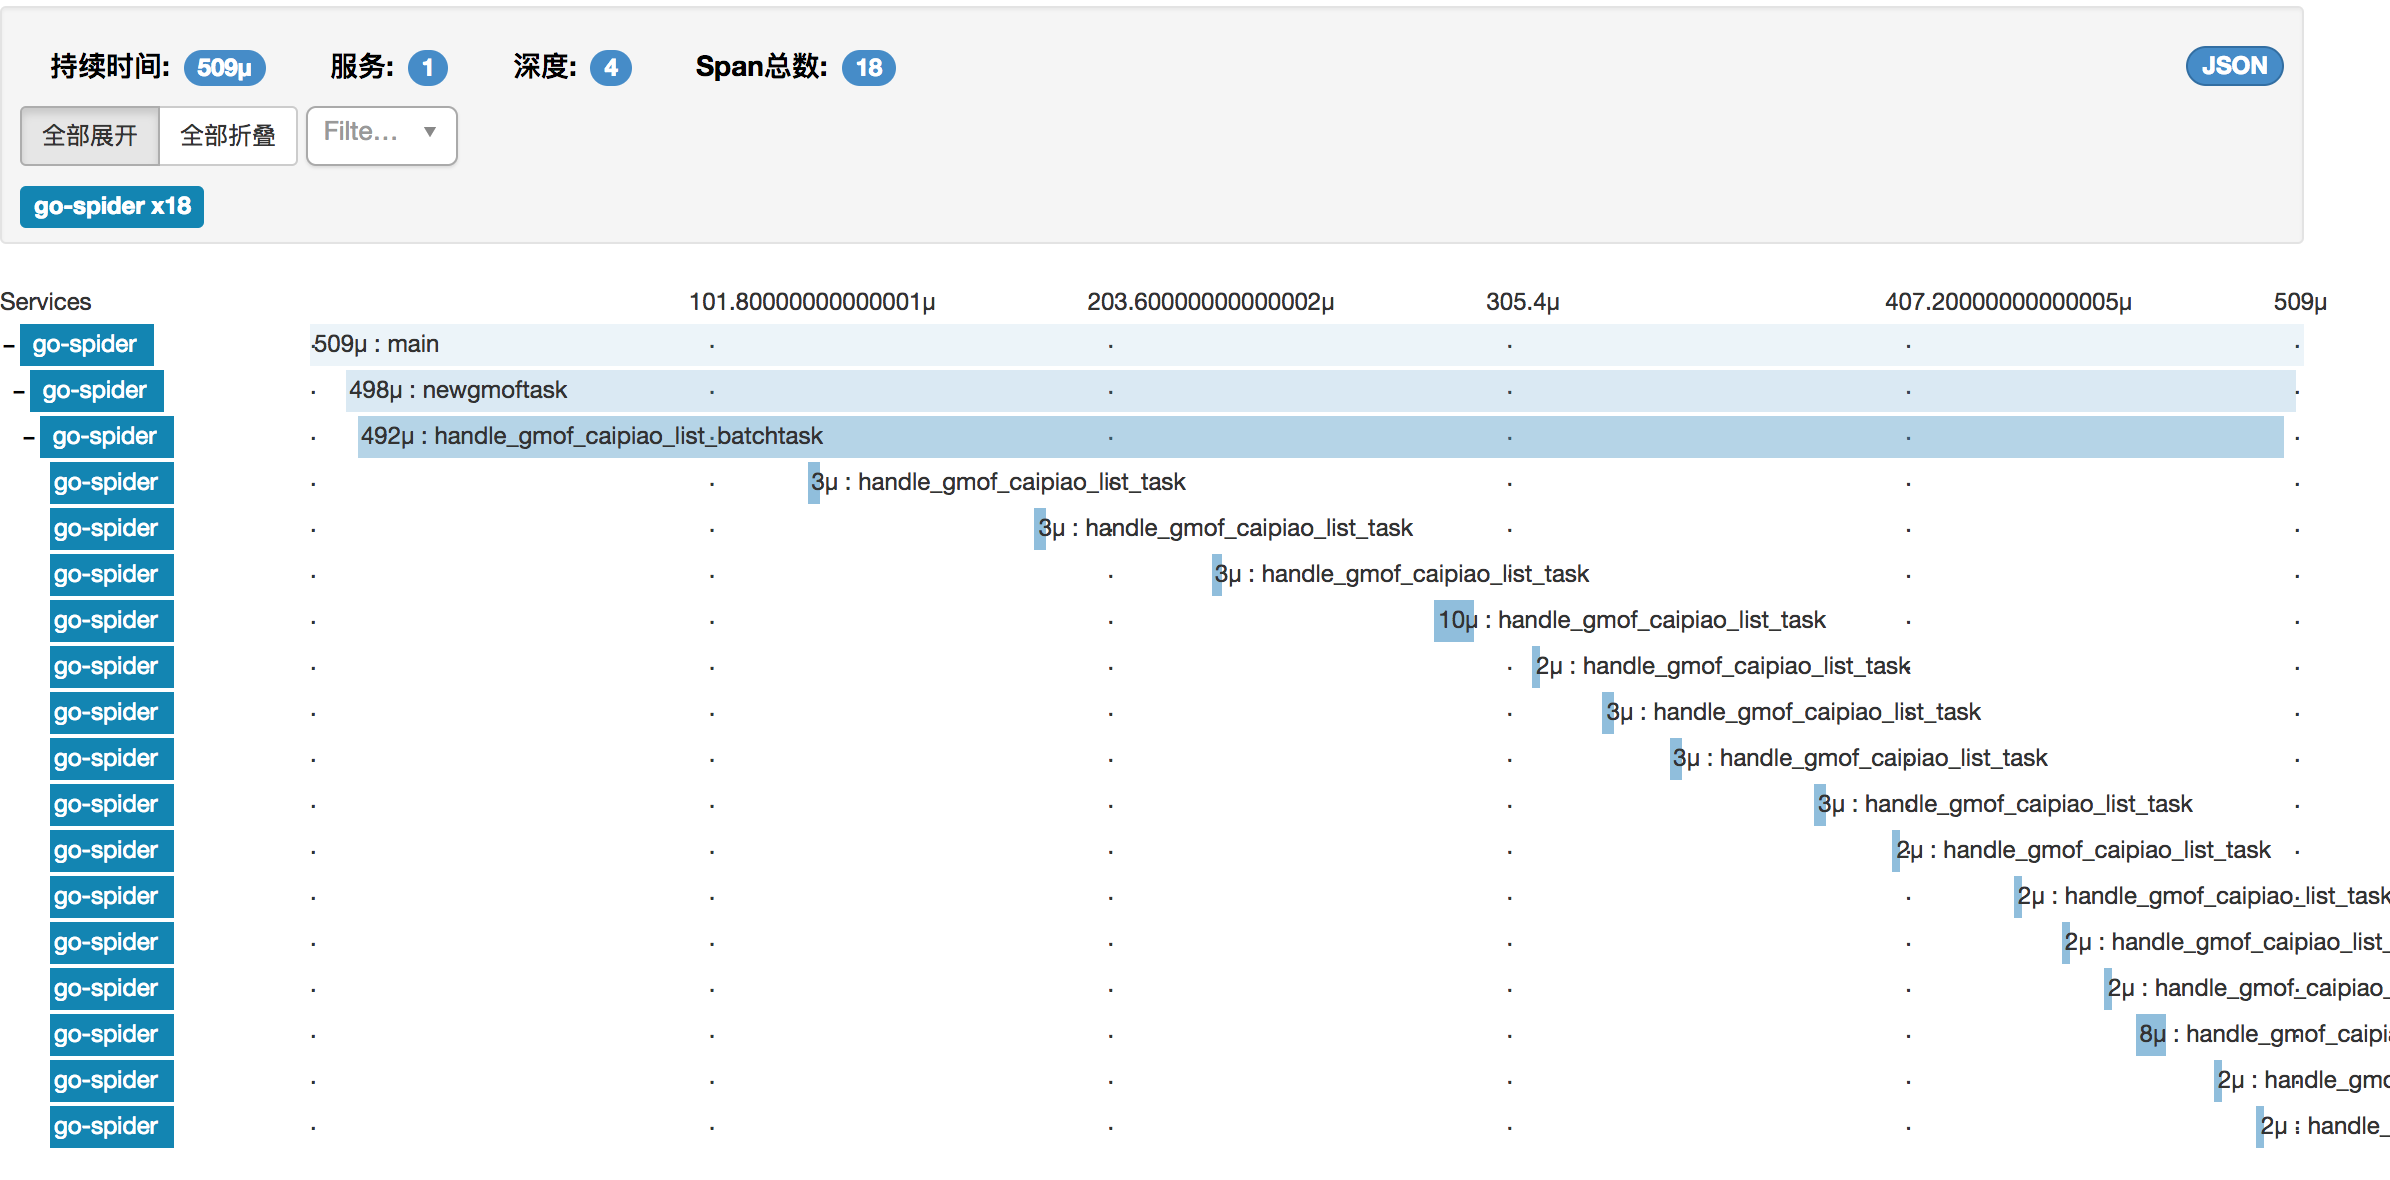
- 函数内容为空(微秒级)
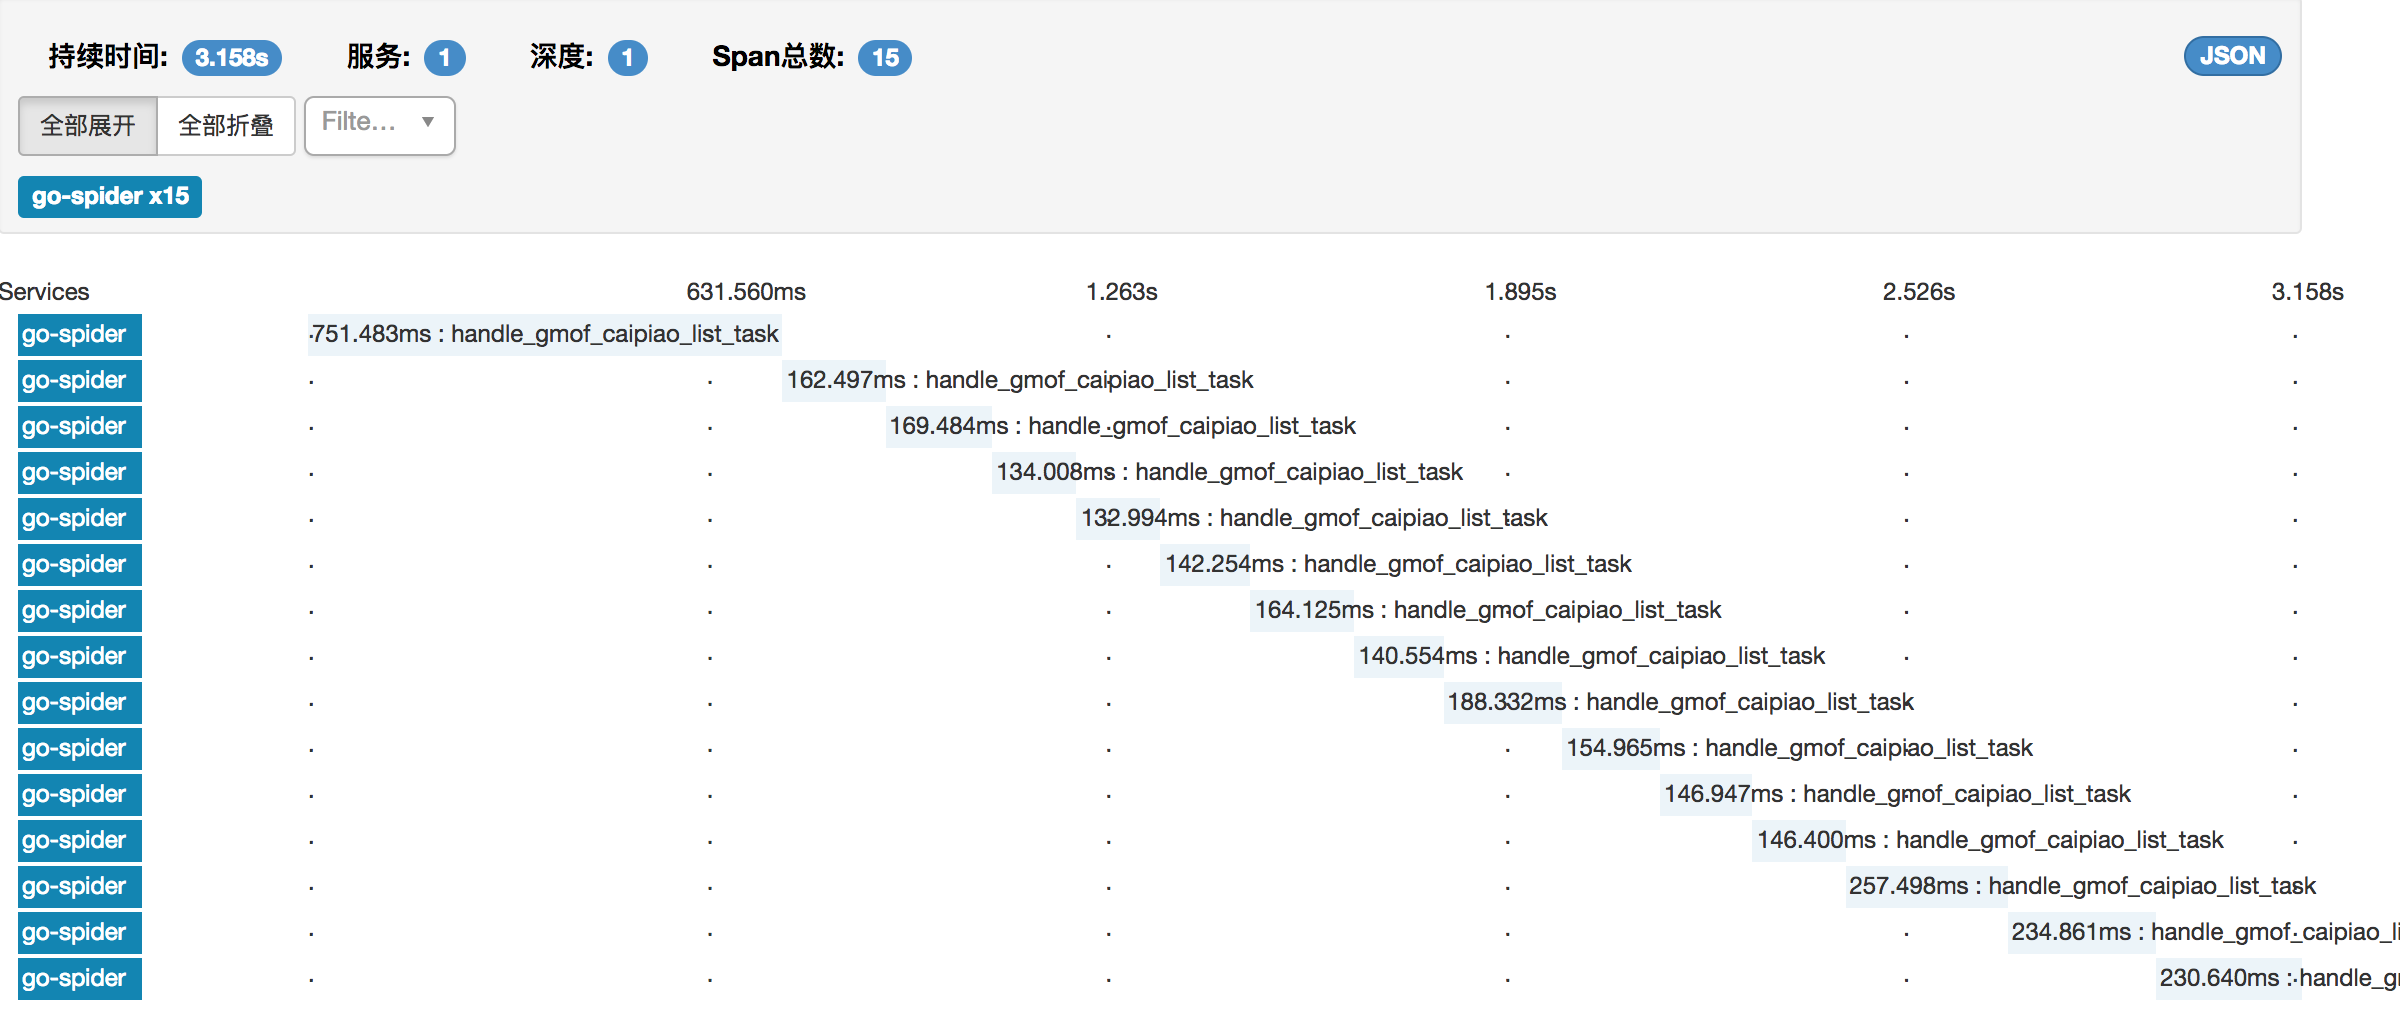
- 串行调用函数方法,内容包括网络访问和持久化操作(毫秒级)
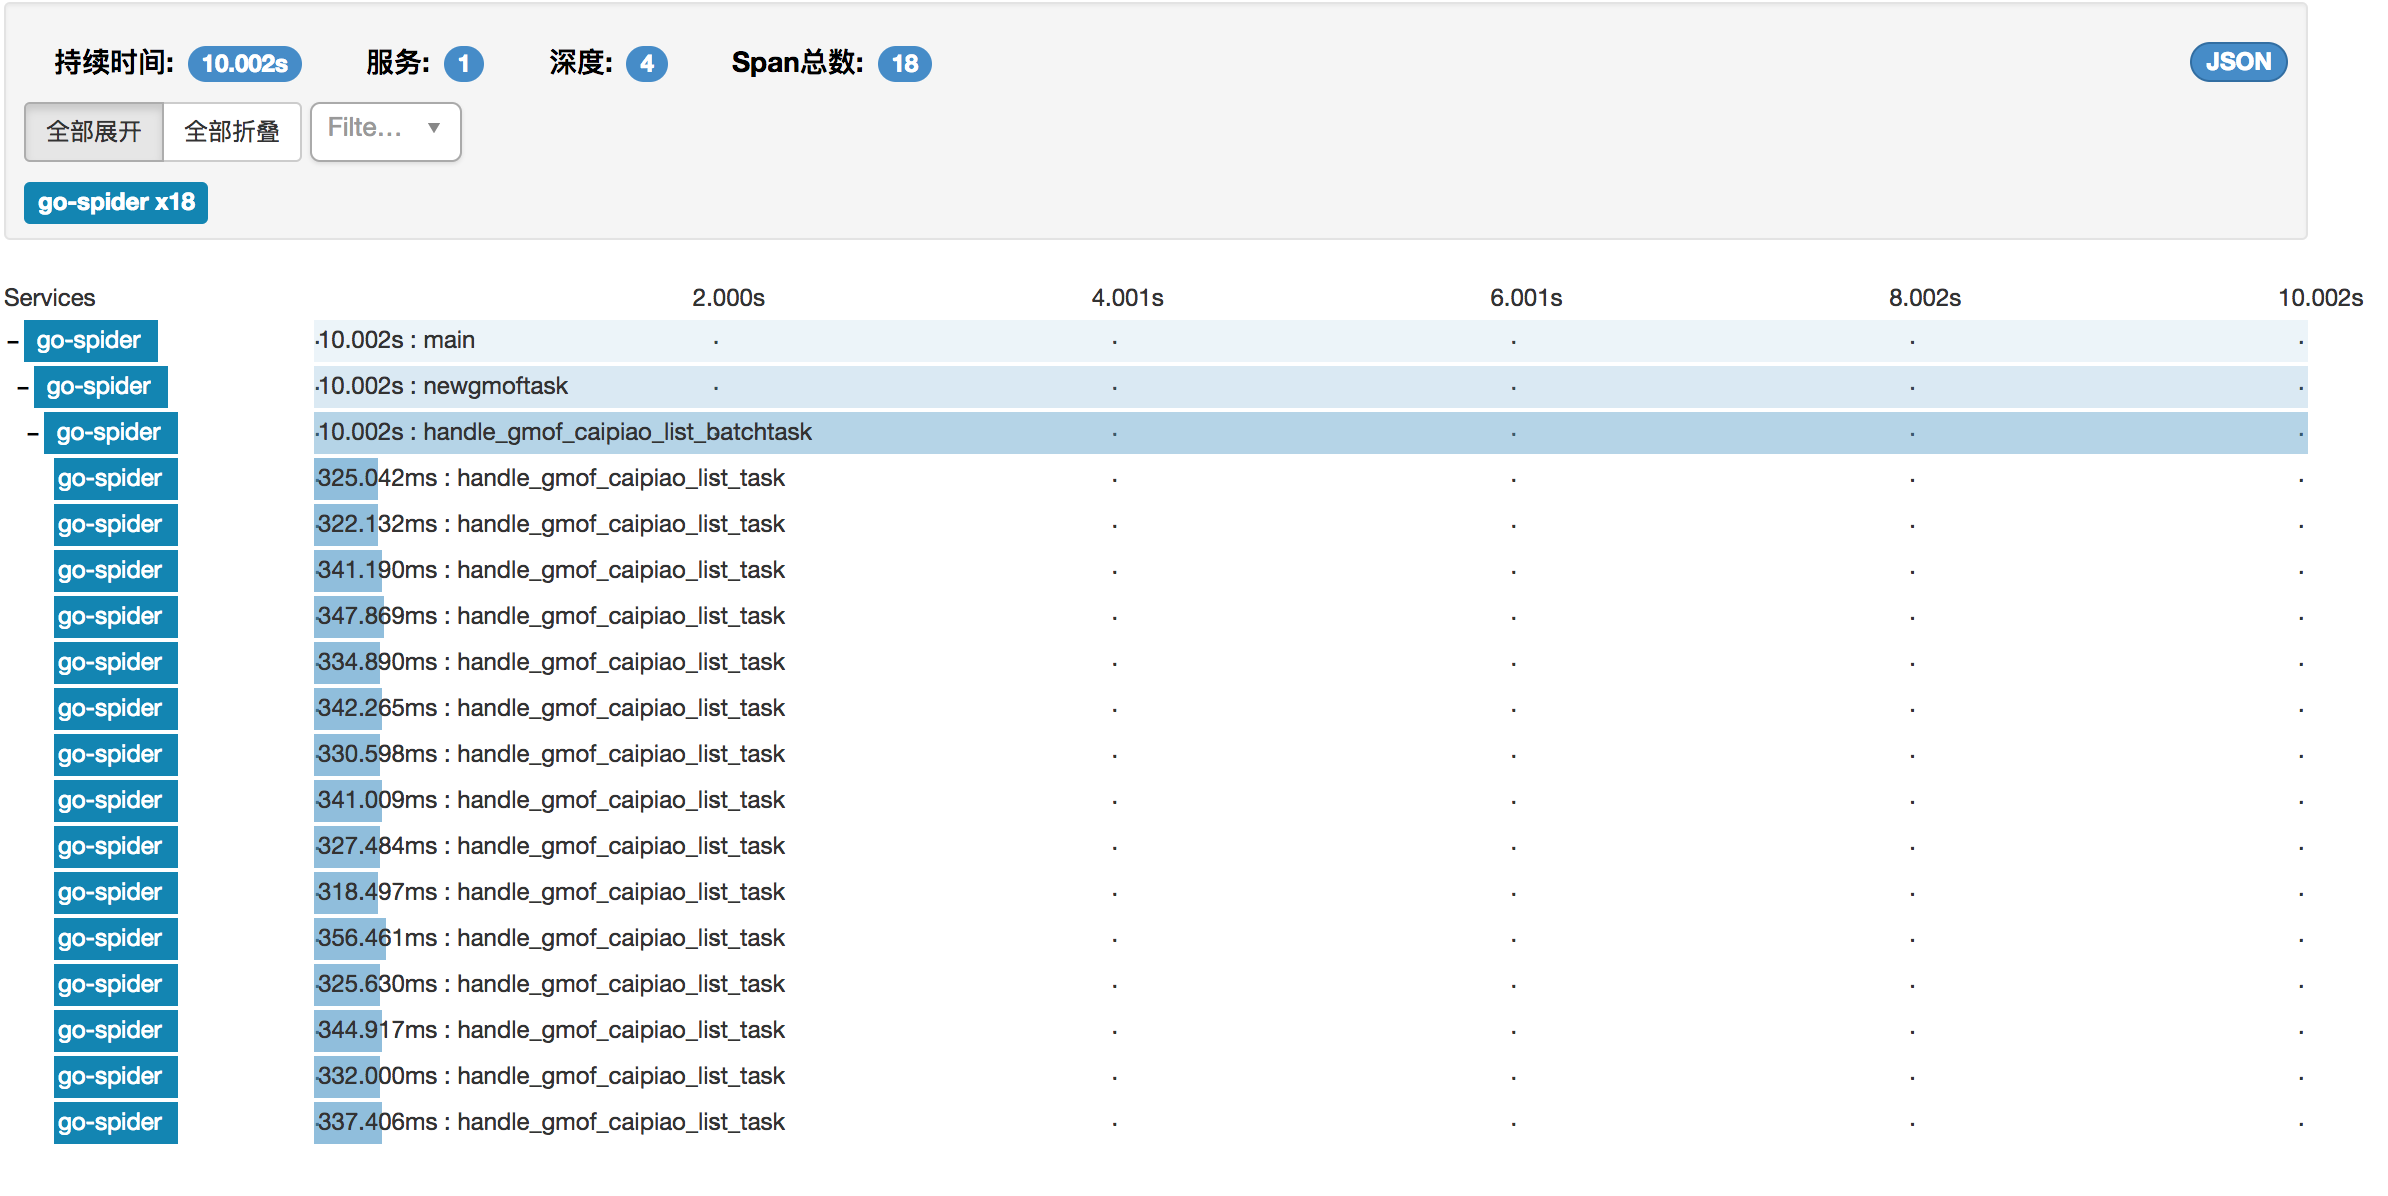
- 并行调用函数方法(Go routine),内容与上同
- 串行/并行混合调用
1 | go go_ping(ctx, "192.168.213.128", 2, time.Second*3, false) |
- 多服务调用
第三部分:OpenCensus Principle | 工作原理 (待续)
数据结构
Span 共有属性:
- TraceId
- SpanId
- Start Time
- End Time
- Status
Span 可选属性:
- Parent SpanId
- Remote Parent
- Attributes
- Annotations
- Message Events
- Links
1 | //go.opencensus.io/trace.go |

上下文 Context
上下文 Context 按照树型关系构建。以 Golang 为例,创建 Context 树第一步就是通过 context.Background() 得到根节点,再由 WithCancel()、WithTimeout() 等函数创建其它的子节点,孙节点。子节点从父节点复制得到,在子节点也可以设定新的状态值,如此就可以使元数据在子节点之间层层传递。
1 |
|
- gRPC Client
1 | conn, err := grpc.Dial(address, grpc.WithStatsHandler(&ocgrpc.ClientHandler{}), grpc.WithInsecure()) |
- gRPC Server
1 | // SayHello implements helloworld.GreeterServer |
- go.opencensus.io/trace.go 源码
1 | //go.opencensus.io/trace.go |
视图
- 注册-订阅 模式
视图注册之后开始收集给定的数据。一旦该视图被订阅,它就向已注册的 Exporter 报送数据。
1 | // source code : go.opencensus.io/view/worker.go |
Exporter
1 | // source: go.opencensus.io/trace/export.go |
OpenCensu 资讯
Microsoft joins the OpenCensus project | June 13,2018
We are happy to announce that Microsoft is joining the open source OpenCensus project, originally initiated and shepherded by Google, and we are excited to help it achieve the goal of “a single distribution of libraries for metrics and distributed tracing with minimal overhead.”
微软宣布加入开源项目 OpenCensus —— 最初是由 Google 发起和主导,旨在建立一个低开销的分布式追踪和度量库。
现代基于云的应用程序通常是分布式的, 需要专门的监测和追踪技术来跟踪定位故障和性能问题。Azure 应用程序内置 Application Map,应用程序映射|会审分布式应用程序 和 End-to-End Transaction Diagnostics,端到端跨组件事务诊断功能。但是目前的监测工具体系中缺乏一个标准化的平台来实现度量和分布式跟踪, 这些数据需要支持跨编程语言和技术栈。微软宣称将利用自己的经验和知识与 OpenCensus 社区合作, 在应用程序度量和分布式跟踪领域创建一个开放和可扩展的标准平台, 从而使所有客户受益。
Our goal is to leverage our experience and knowledge and combine it with that of OpenCensus community to create an open and extensible, standard platform for application metrics and distributed traces that will benefit all customers.
应用程序映射可帮助发现性能瓶颈或热点失败的所有组件的分布式应用程序。在地图上的每个节点表示应用程序组件或其依赖项;并且有运行状况 KPI 和警报状态。可从任何组件单击以获得更详细的诊断,如 Application Insights 事件。 如果应用使用了 Azure 服务,还可以单击获得 Azure 诊断,如 SQL 数据库顾问建议。

事务诊断功能将所有受 Application Insights 监视的组件中的服务器端遥测关联到一个单独的视图。Application Insights 可检测基础关系,并可用于诊断导致事务缓慢或失败的应用程序组件、依赖项或异常。
Tips
Docker
1 | $ docker image pull openzipkin/zipkin |
Source
1 | # get the latest source |
1 | ******** |
扩展阅读
分布式追踪系统
动态追踪技术
- 动态追踪技术(一):DTrace 导论
- 动态追踪技术(二):strace+gdb 溯源 Nginx 内存溢出异常
- 动态追踪技术(三):Tracing Your Kernel Function!
- 动态追踪技术(四):基于 Linux bcc/BPF 实现 Go 程序动态追踪
- 动态追踪技术(五):Welcome DTrace for Linux
开源架构技术漫谈
- 基于Go语言快速构建一个RESTful API服务
- 基于Kafka构建事件溯源型微服务
- 数据可视化(七)Graphite 体系结构详解
- DevOps 资讯 | LinkedIn 开源 Kafka Monitor
参考文献
- “Hello, world!” for web servers in Go with OpenCensus
- OpenCensus: A Stats Collection and Distributed Tracing Framework | Wednesday, January 17, 2018 | Google Open Source Blog
- OpenCensus for Go gRPC developers
- Uber正式开源其分布式跟踪系统Jaeger | 2017年11月9日
- Uber优步分布式追踪技术再度精进
- Measure Once — Export Anywhere: OpenCensus in the wild
- opencensus-go-examples-helloworld-context
- MongoDB driver instrumented with OpenCensus in Go
- Go语言并发模型:使用 context | oscarzhao 2016年08月29日
- 理解Go Context机制 | 时间: 2016-08-02
- Go语言实战笔记(二十)| Go Context | May 12, 2017