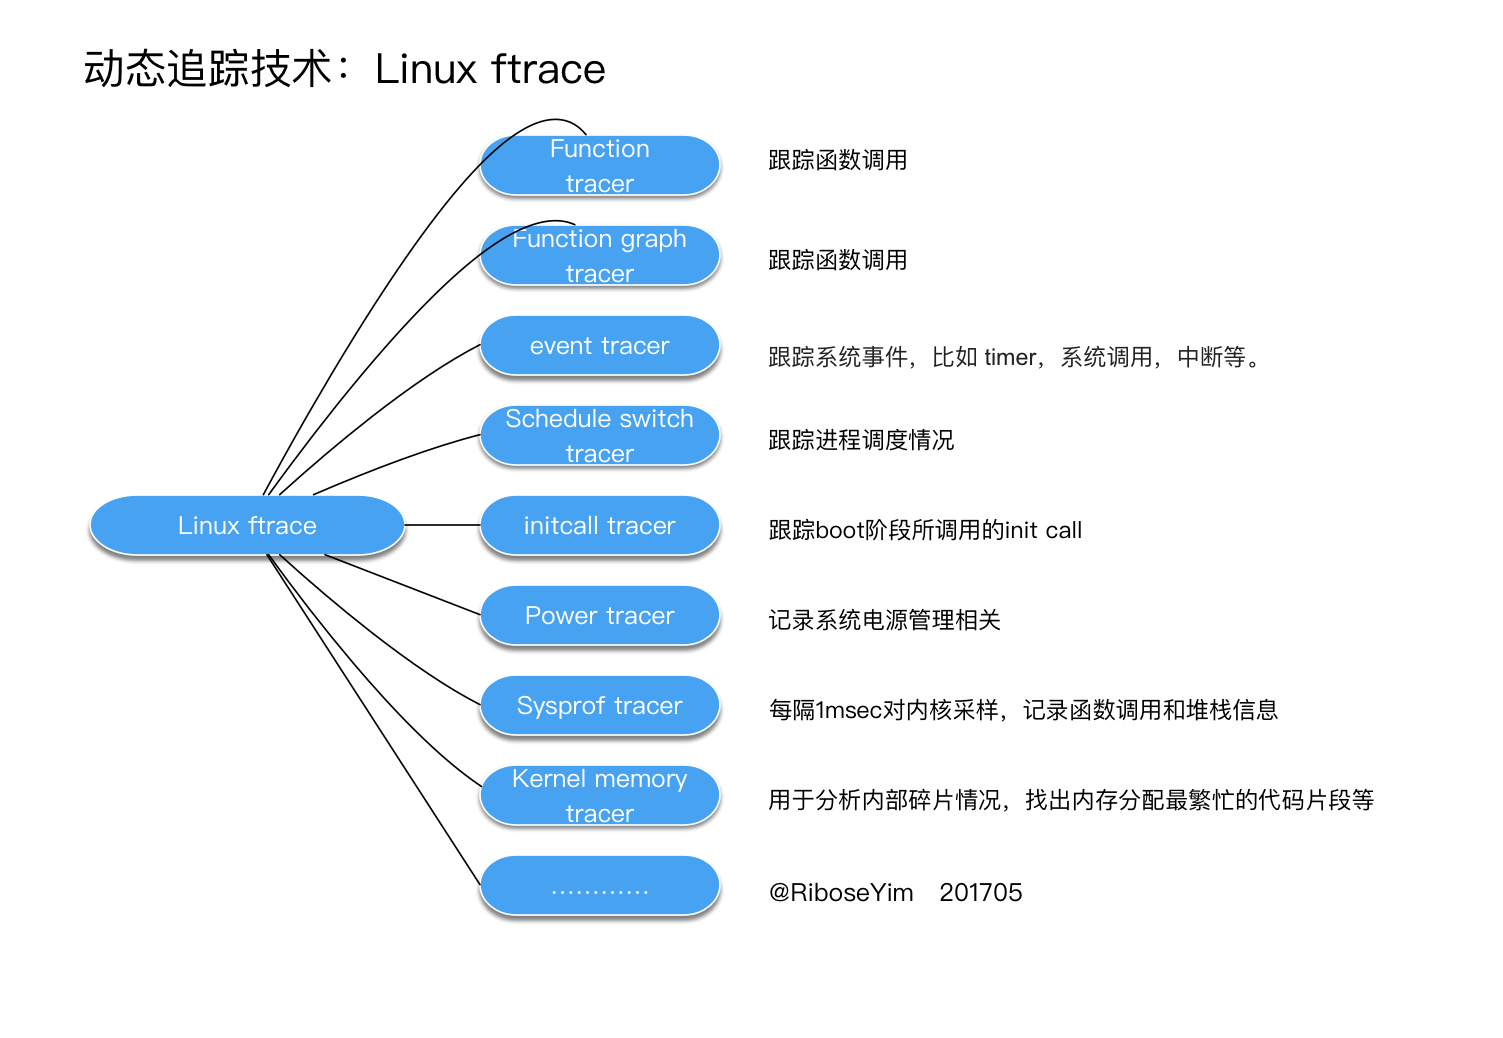
摘要 Ftrace 是一个设计用来帮助开发者和设计者监视内核的追踪器,可用于调试或分析延迟以及性能问题。ftrace 令人印象最深刻的是作为一个 function tracer,内核函数调用、耗时等情况一览无余。另外,ftrace 最常见的用途是事件追踪,通过内核是成百上千的静态事件点,看到系统内核的哪些部分在运行。实际上,ftrace 更是一个追踪框架,它具备丰富工具集:延迟跟踪检查、何时发生中断、任务的启用、禁用及抢占等。在 ftrace 的基线版本之上,还有很多第三方提供的开源工具,用于简化操作或者提供数据可视化等扩展应用。
一、Introduction Developer(s): Steven Rostedt(RedHat) and otherswww.kernel.org/doc/Documentation/trace
二、ABC 在使用ftrace之前,需要确认调试目录是否已经挂载,默认目录:**/sys/kernel/debug/** 。
debugfs是Linux内核中一种特殊的文件系统,非常易用、基于RAM,专门设计用于调试。(since version 2.6.10-rc3,https://en.wikipedia.org/wiki/Debugfs)。
1
2
3
4
mount -t debugfs none /sys/kernel/debug 或者指定到自己的目录 mkdir /debugmount -t debugfs nodev /debug
挂载之后会自动创建如下文件:
1
2
3
4
5
6
7
8
9
10
11
12
13
14
15
16
17
18
19
20
21
22
23
24
25
26
27
28
29
30
31
32
33
34
35
36
37
38
39
40
41
42
43
44
45
46
47
48
49
50
/sys/kernel/debug drwxr-xr-x. 2 root root 0 12月 28 17:24 x86 drwxr-xr-x. 3 root root 0 12月 28 17:24 boot_params drwxr-xr-x. 34 root root 0 12月 28 17:24 bdi -r--r--r--. 1 root root 0 12月 28 17:24 gpio drwxr-xr-x. 3 root root 0 12月 28 17:24 usb drwxr-xr-x. 4 root root 0 12月 28 17:24 xen drwxr-xr-x. 6 root root 0 12月 28 17:24 tracing drwxr-xr-x. 2 root root 0 12月 28 17:24 extfrag drwxr-xr-x. 2 root root 0 12月 28 17:24 dynamic_debug drwxr-xr-x. 2 root root 0 12月 28 17:24 hid -rw-r--r--. 1 root root 0 12月 28 17:24 sched_features drwxr-xr-x. 2 root root 0 12月 28 17:24 mce drwxr-xr-x. 2 root root 0 12月 28 17:24 kprobes -r--r--r--. 1 root root 0 12月 28 17:24 vmmemctl /sys/kernel/debug/tracing -rw-r--r--. 1 root root 0 12月 28 17:24 tracing_thresh -rw-r--r--. 1 root root 0 12月 28 17:24 tracing_on -rw-r--r--. 1 root root 0 12月 28 17:24 tracing_max_latency -rw-r--r--. 1 root root 0 12月 28 17:24 tracing_enabled -rw-r--r--. 1 root root 0 12月 28 17:24 tracing_cpumask drwxr-xr-x. 2 root root 0 12月 28 17:24 trace_stat -r--r--r--. 1 root root 0 12月 28 17:24 trace_pipe -rw-r--r--. 1 root root 0 12月 28 17:24 trace_options --w--w----. 1 root root 0 12月 28 17:24 trace_marker -rw-r--r--. 1 root root 0 12月 28 17:24 trace_clock -rw-r--r--. 1 root root 0 12月 28 17:24 trace -rw-r--r--. 1 root root 0 12月 28 17:24 sysprof_sample_period -r--r--r--. 1 root root 0 12月 28 17:24 set_graph_function -rw-r--r--. 1 root root 0 12月 28 17:24 set_ftrace_pid -rw-r--r--. 1 root root 0 12月 28 17:24 set_ftrace_notrace -r--r--r--. 1 root root 0 12月 28 17:24 saved_cmdlines -r--r--r--. 1 root root 0 12月 28 17:24 README drwxr-xr-x. 2 root root 0 12月 28 17:24 options -rw-r--r--. 1 root root 0 12月 28 17:24 function_profile_enabled -r--r--r--. 1 root root 0 12月 28 17:24 dyn_ftrace_total_info -rw-r--r--. 1 root root 0 12月 28 17:24 buffer_size_kb -r--r--r--. 1 root root 0 12月 28 17:24 available_tracers -r--r--r--. 1 root root 0 12月 28 17:24 available_filter_functions -rw-r--r--. 1 root root 0 12月 28 17:24 set_event -r--r--r--. 1 root root 0 12月 28 17:24 printk_formats drwxr-xr-x. 34 root root 0 12月 28 17:24 per_cpu drwxr-xr-x. 24 root root 0 12月 28 17:24 events -r--r--r--. 1 root root 0 12月 28 17:24 available_events -r--r--r--. 1 root root 0 12月 28 17:24 kprobe_profile -rw-r--r--. 1 root root 0 12月 28 17:24 kprobe_events -r--r--r--. 1 root root 0 12月 28 17:24 stack_trace -rw-r--r--. 1 root root 0 12月 28 17:24 stack_max_size -rw-r--r--. 1 root root 0 5月 31 11:50 current_tracer -rwxr-xr-x. 1 root root 0 5月 31 11:57 set_ftrace_filter
三、BASIC 1. Function tracer 以Function tracer为例,结果存储在 trace ,该文件类似一张报表,该表将显示 4 列信息。首先是进程信息,包括进程名和PID ;第二列是CPU;第三列是时间戳;第四列是函数信息,缺省情况下,这里将显示内核函数名以及它的上一层调用函数。
1
2
3
4
5
6
7
8
9
10
11
12
13
14
15
16
cd /sys/kernel/debug/tracing echo function > current_tracer cat trace # tracer: function # # TASK-PID CPU# TIMESTAMP FUNCTION # | | | gmond-6684 [004 ] 13285965.088308 : _spin_lock <-hrtimer_interrupt gmond-6684 [004 ] 13285965.088308 : ktime_get_update_offsets <-hrtimer_interrupt gmond-6684 [004 ] 13285965.088309 : __run_hrtimer <-hrtimer_interrupt gmond-6684 [004 ] 13285965.088309 : __remove_hrtimer <-__run_hrtimer gmond-6684 [004 ] 13285965.088309 : tick_sched_timer <-__run_hrtimer gmond-6684 [004 ] 13285965.088309 : ktime_get <-tick_sched_timer gmond-6684 [004 ] 13285965.088310 : tick_do_update_jiffies64 <-tick_sched_timer gmond-6684 [004 ] 13285965.088310 : update_process_times <-tick_sched_timer
2. Function graph tracer Function graph tracer 和 function tracer 类似,但输出为函数调用图,更加容易阅读:
1
2
3
4
5
6
7
8
9
10
11
12
13
14
15
16
17
18
19
20
21
22
# tracer: function_graph # # TIME CPU DURATION FUNCTION CALLS # | | | | | | | | 21 ) ==========> | 21 ) | smp_apic_timer_interrupt() { 31 ) ==========> | 31 ) | smp_apic_timer_interrupt() { 8 ) | smp_apic_timer_interrupt() { 11 ) 2.598 us | native_apic_mem_write(); 18 ) 3.106 us | native_apic_mem_write(); 30 ) ==========> | 30 ) | smp_apic_timer_interrupt() { 3 ) 3.590 us | native_apic_mem_write(); 22 ) 2.944 us | native_apic_mem_write(); 7 ) 3.392 us | native_apic_mem_write(); 17 ) ==========> | 17 ) | smp_apic_timer_interrupt() { 27 ) ==========> | 27 ) | smp_apic_timer_interrupt() { 16 ) ==========> | 16 ) | smp_apic_timer_interrupt() {
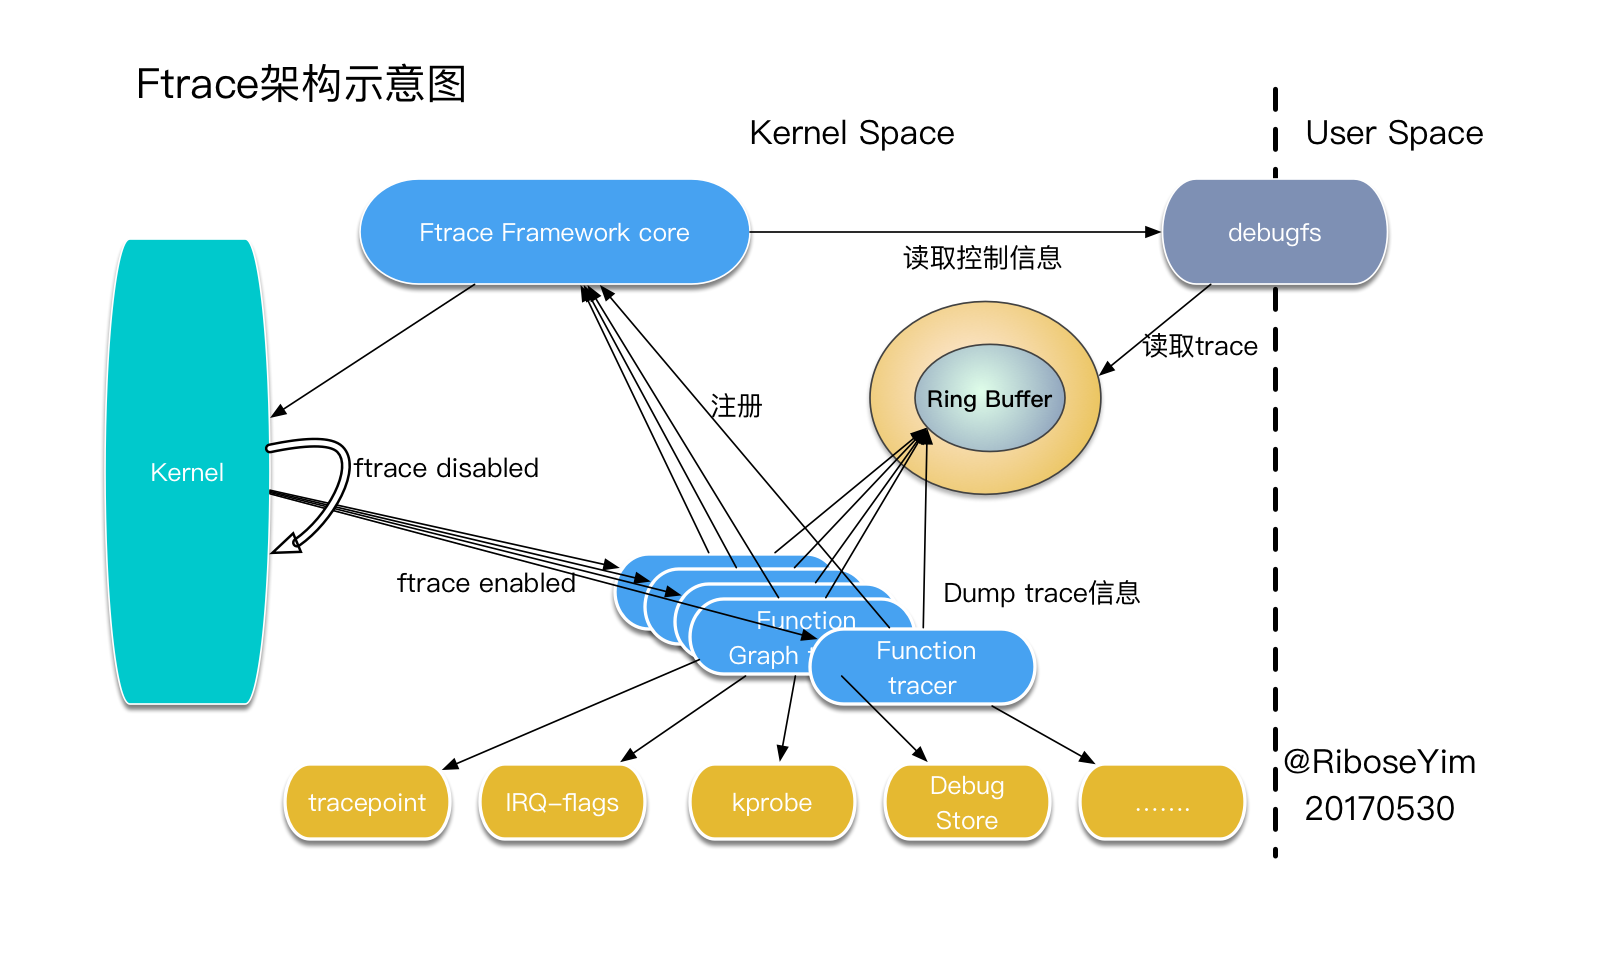
四、体系结构 Ftrace有两大组成部分,framework和一系列的tracer 。每个tracer完成不同的功能,它们统一由framework管理。 ftrace 的trace信息保存在ring buffer中,由framework负责管理。Framework 利用debugfs建立tracing目录,并提供了一系列的控制文件。
ftrace is a dynamic tracing system. 当你开始“ftracing”一个内核函数的时候,该函数的代码实际上就已经发生变化了。内核将在程序集中插入一些额外的指令,使得函数调用时可以随时通知追踪程序。
WARNNING:使用ftrace追踪内核将有可能对系统性能产生影响,追踪的函数越多,开销越大。
1 2 blk kmemtrace function_graph wakeup_rt wakeup function sysprof sched_switch initcall nop
1. trace-cmd trace-cmd是一个非常有用的Ftrace命令行工具。
1
2
3
sudo apt-get install trace-cmd 或者 git clone git://git.kernel.org/pub/scm/linux/kernel/git/rostedt/trace-cmd.git
使用方法:
1
2
3
4
5
6
sudo trace-cmd record --help sudo trace-cmd record -p function -P 123456 sudo trace-cmd record -p function -l do_page_fault plugin 'function' Hit Ctrl^C to stop recording
trace.dat
1
2
3
4
5
6
7
8
9
10
11
12
$ sudo trace-cmd report chrome-15144 [000 ] 11446.466121 : function: do_page_fault chrome-15144 [000 ] 11446.467910 : function: do_page_fault chrome-15144 [000 ] 11446.469174 : function: do_page_fault chrome-15144 [000 ] 11446.474225 : function: do_page_fault chrome-15144 [000 ] 11446.474386 : function: do_page_fault chrome-15144 [000 ] 11446.478768 : function: do_page_fault CompositorTileW-15154 [001 ] 11446.480172 : function: do_page_fault chrome-1830 [003 ] 11446.486696 : function: do_page_fault CompositorTileW-15154 [001 ] 11446.488983 : function: do_page_fault CompositorTileW-15154 [001 ] 11446.489034 : function: do_page_fault CompositorTileW-15154 [001 ] 11446.489045 : function: do_page_fault
在很有情况下不能使用函数追踪,需要依赖 事件追踪 的支持,例如:
1 2 3 4 5 6 7 8 9 10 11 12 13 14 15 16 17 18 19 20 21 22 23 power:power_start power:power_frequency power:power_end sched :sched_kthread_stopsched :sched_kthread_stop_retsched :sched_wait_tasksched :sched_wakeupsched :sched_wakeup_newsched :sched_switchsched :sched_migrate_tasksched :sched_process_freesched :sched_process_exitsched :sched_process_waitsched :sched_process_forksched :sched_stat_waitsched :sched_stat_sleepsched :sched_stat_iowaitsched :sched_stat_runtimesudo trace-cmd record -e sched :sched_switch sudo trace-cmd report
输出如下:
1
2
3
4
5
16169.624862: Chrome_ChildIOT:24817 [112] S ==> chrome:15144 [120] 16169.624992: chrome:15144 [120] S ==> swapper/3:0 [120] 16169.625202: swapper/3:0 [120] R ==> Chrome_ChildIOT:24817 [112] 16169.625251: Chrome_ChildIOT:24817 [112] R ==> chrome:1561 [112] 16169.625437: chrome:1561 [112] S ==> chrome:15144 [120]
切换路径:PID 24817 -> 15144 -> kernel -> 24817 -> 1561 -> 15114。
perf-tools 是性能调试大神Brendan Gregg开发的一个工具包,提供了很多强大的功能,例如:
代码下载:https://github.com/brendangregg/perf-tools
1 2 3 4 5 6 7 8 9 10 11 12 13 14 15 16 17 18 19 20 21 22 23 24 Tracing exec ()s. Ctrl-C to end. PID PPID ARGS 22898 22004 man ls 22905 22898 preconv -e UTF-8 22908 22898 pager -s 22907 22898 nroff -mandoc -rLL=164n -rLT=164n -Tutf8 22906 22898 tbl 22911 22910 locale charmap 22912 22907 groff -mtty-char -Tutf8 -mandoc -rLL=164n -rLT=164n 22913 22912 troff -mtty-char -mandoc -rLL=164n -rLT=164n -Tutf8 22914 22912 grotty Tracing block I/O. Output every 1 seconds. Ctrl-C to end. >=(ms) .. <(ms) : I/O |Distribution | 0 -> 1 : 1913 | 1 -> 2 : 438 | 2 -> 4 : 100 | 4 -> 8 : 145 | 8 -> 16 : 43 | 16 -> 32 : 43 | 32 -> 64 : 1 | [...]
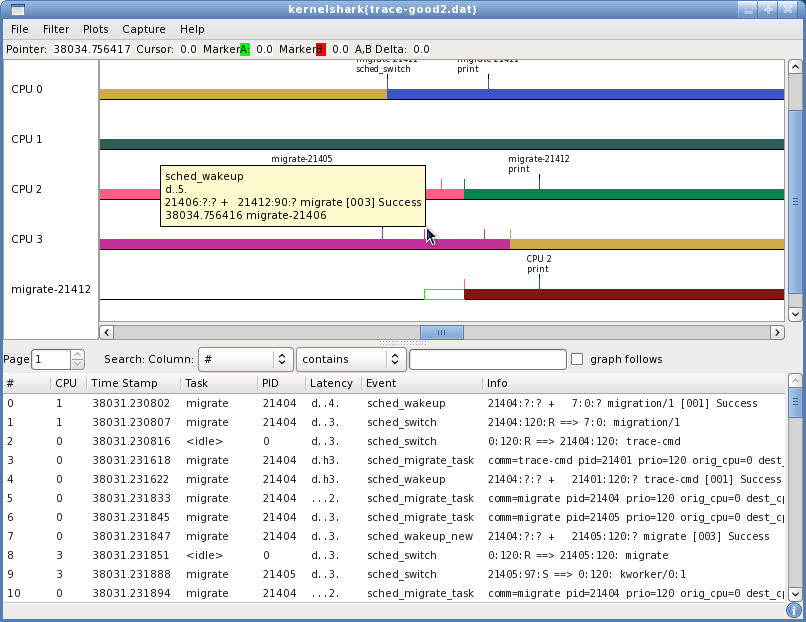
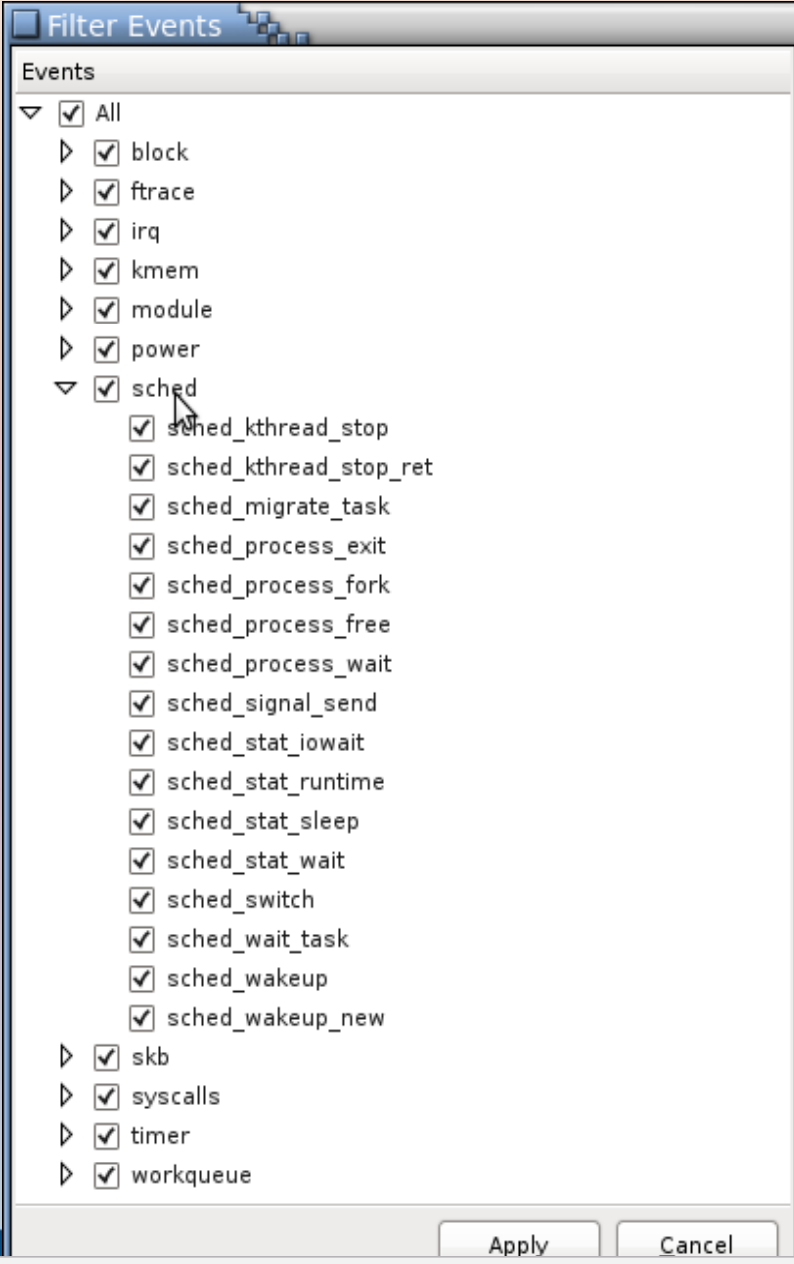
六、可视化工具:KernelShark KernelShark是trace-cmd的前端工具,提供了对trace.dat的可视化分析(Graph View 、List View、Simple and Advance filtering)。
扩展阅读:动态追踪技术
参考文献
source:https://riboseyim.github.io/